URBAN HEALTH CERTIFICATE
Module 1: Introduction to Poverty
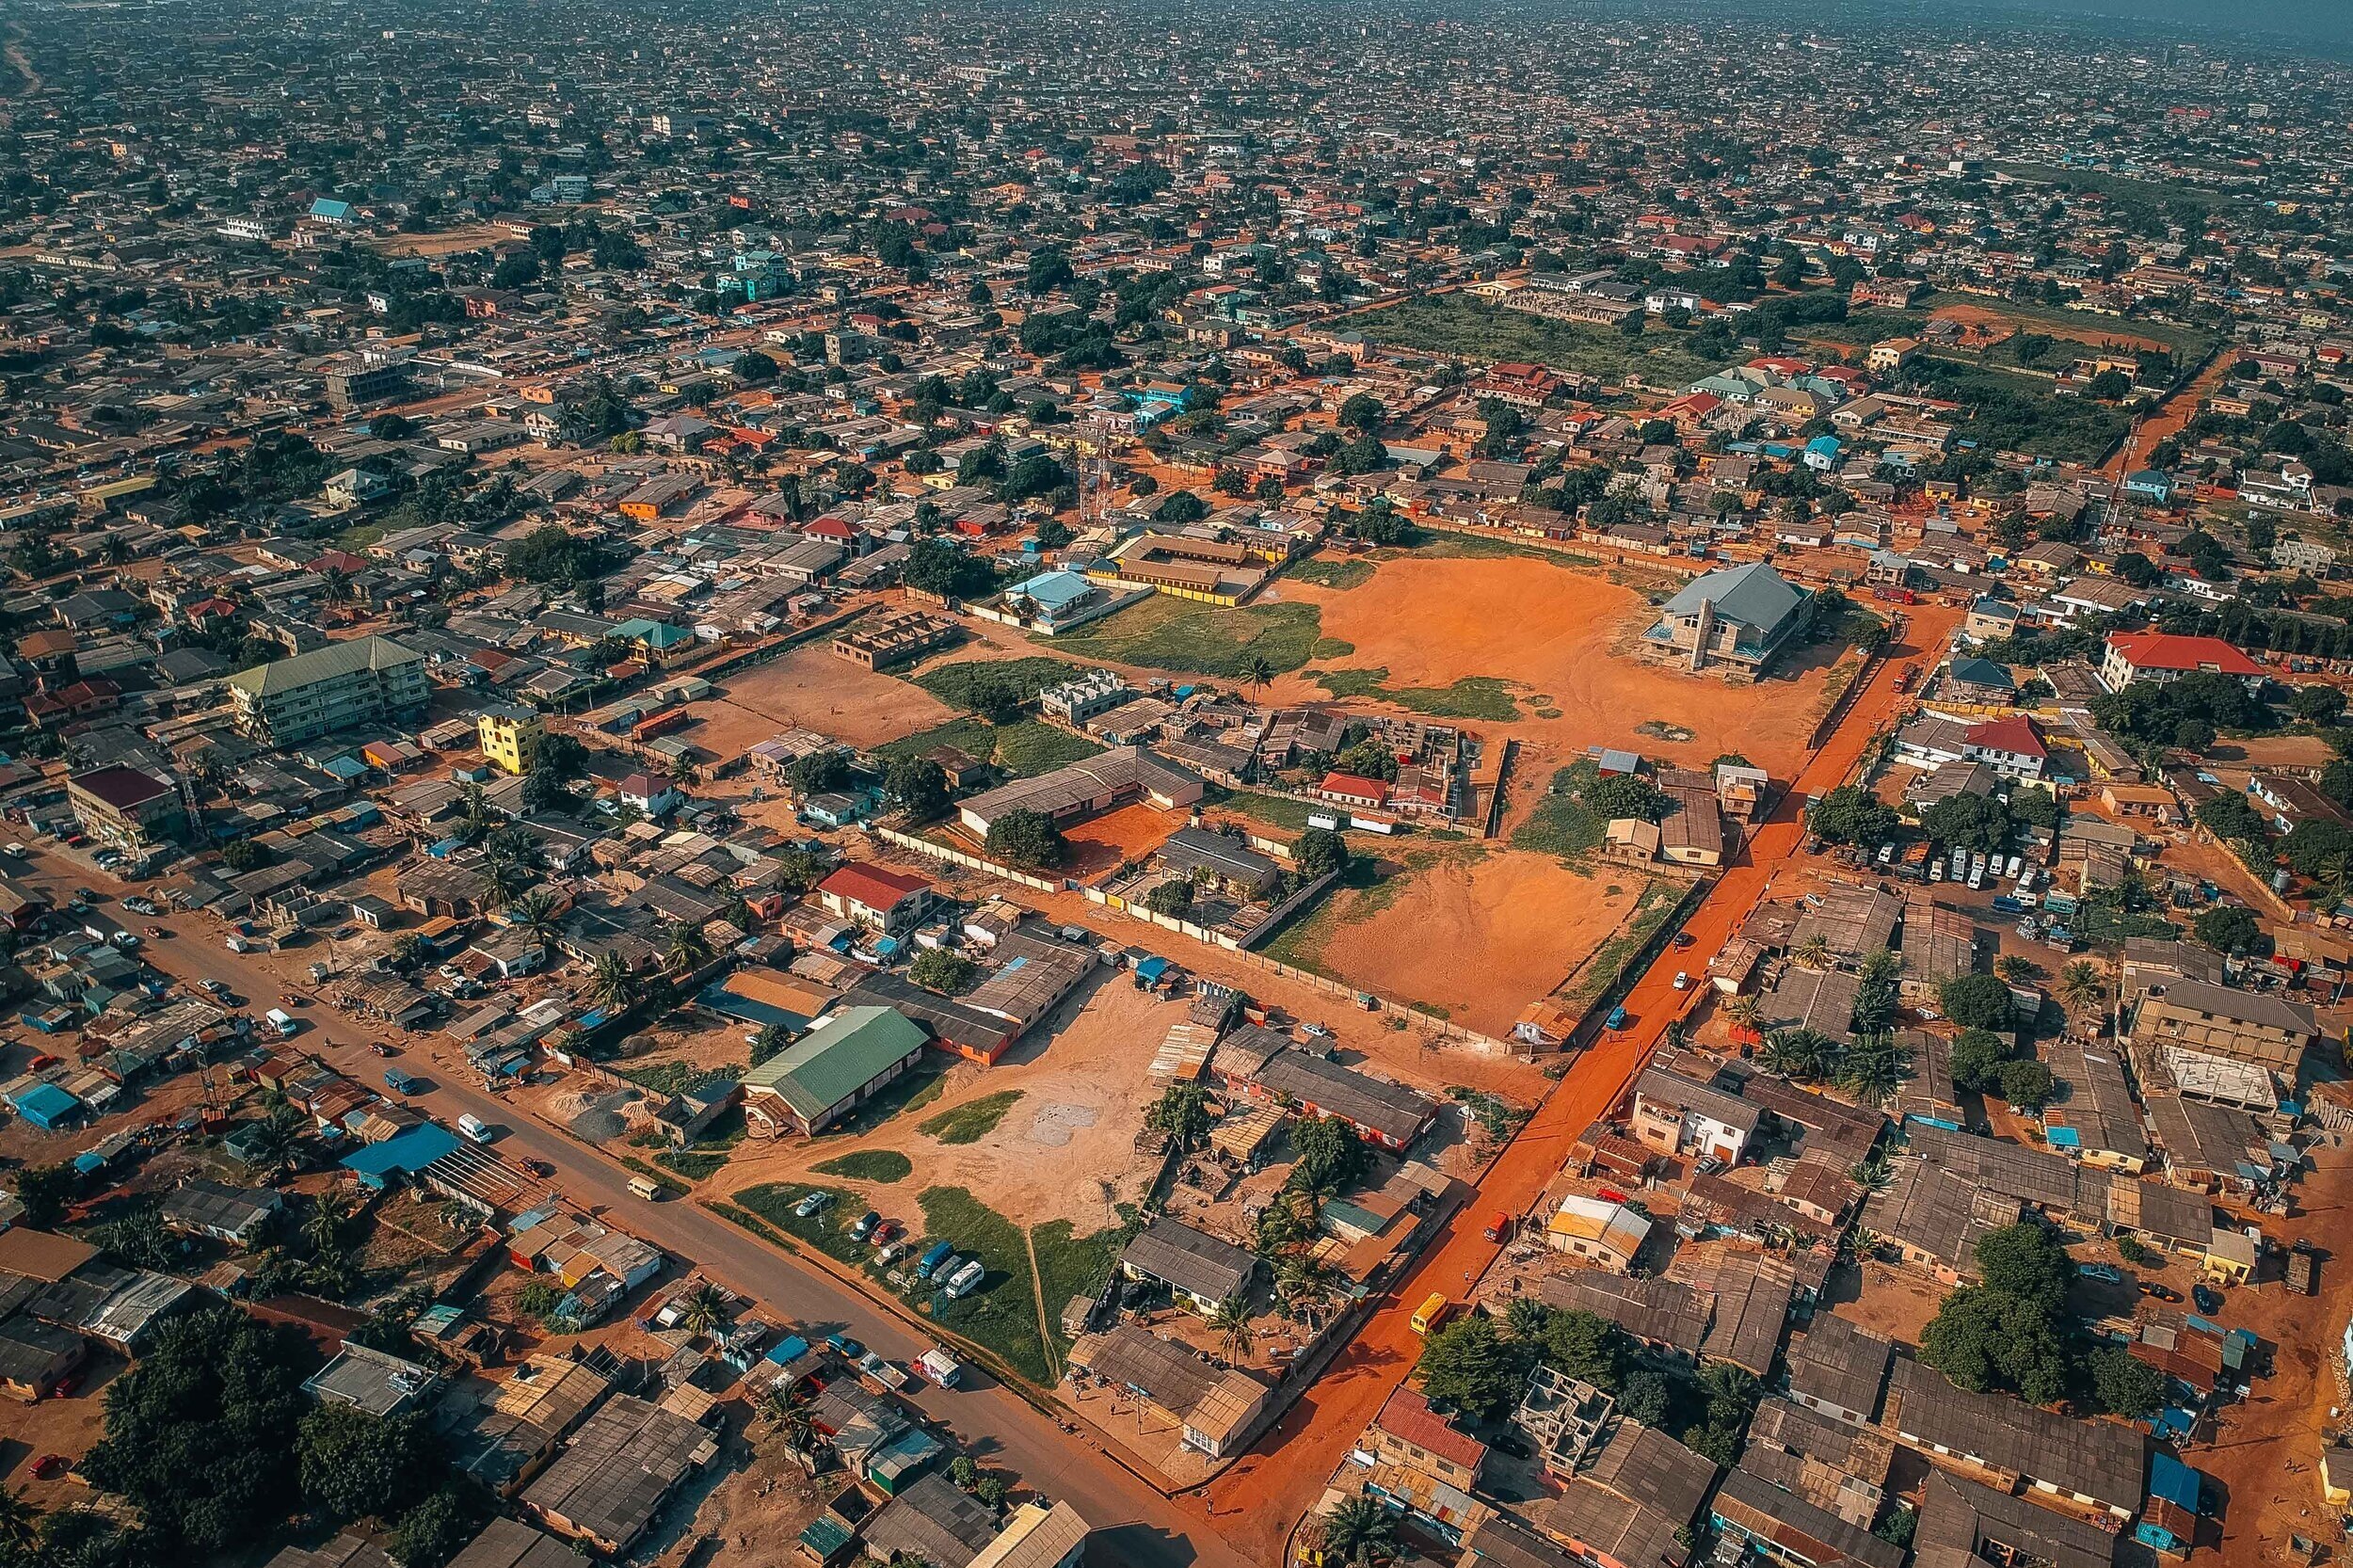
For several thousand years, the world has been experiencing increased urbanization. In 2008, the UN Population Fund announced that the world now has more urban than rural inhabitants, and this trend is far from slowing down.(1) It is projected that between 2007 and 2050, the population of the world will increase by 2.5 billion, at which point two-thirds of the Global South will reside in urban areas.(2) About 27% of the world’s population will reside in cities with at least 1 million inhabitants by 2030.(3) Cities offer many health benefits, including large markets with a reliable food supply, economies of scale, stable public services, and a collection of educated individuals that contribute to enterprise, education, and innovation.(4)
However, while urbanization has helped improve development and health in the long run, it has produced some negative consequences as well. As populations increase at unprecedented rates, communities are overwhelming cities that lack adequate infrastructure and municipal organization to handle the rising challenges. This situation is most problematic in the Global South, where urban slums and other areas with concentrated populations have grown, thereby increasing greenhouse gas emissions. Further, these countries face an elevated risk of disease, while health care systems struggle to catch up and are unable to respond effectively.(5)
What are Poverty Levels?
Measures of poverty have traditionally been based on income or consumption, and many official measures of poverty, particularly in the Global South, are still centered on these figures. To calculate food consumption, a standard measure is specified, typically in terms of a “basket” of basic nutritional necessities. The estimated monetary income required to purchase the basket then sets the food poverty line. To calculate the overall poverty line, non-food goods and services such as shelter, health care and clothing are added to the food calculations. Additionally, surveys of living standards gauge consumption based on ownership of items such as a bicycle or refrigerator, and include questions about the materials used to construct the home.(6)
Recently, the focus has moved beyond traditional measures and switched to a more multidimensional analysis, as income or consumption alone may produce false notions of poverty. In his Population Bulletin, Mark Montgomery provides a framework for multiple aspects of urban well-being. This consists of the following areas:
Health
Consumption (of private goods and services, leisure, shelter, and health services)
Freedom from violence and crime
Personal efficacy
Collective efficacy and political voice
Links between dimensions can provide a more comprehensive understanding of poverty. For instance, a household that is not considered poor in terms of one of the above variables may lack in many other vital areas of well-being. This is clear in places such as Indian slums, where many families’ consumption levels place them far above the poverty line, though their houses are so poorly constructed that they could be considered inhospitable.(7)
Urban absolute poverty usually includes interrelated deprivations relating to each of Montgomery’s dimensions. These typically include:
Inadequate income and problems with debt
Inadequate and unstable asset base (both material and nonmaterial such as housing and education)
Inadequate shelter
Inadequate supply of basic services
Limited or no safety net to ensure basic consumption and access to shelter and health care when income falls
Inadequate provision of public infrastructure
Inadequate protection of rights through the law
Voicelessness and powerlessness as a group within political systems, resulting in little chance of receiving support for the community’s own initiatives or ensuring aid from NGOs, public agencies, and private utilities (8)
Poverty Scorecards
Poverty scorecards were developed by Mark Schreiner, the director of Microfinance Risk Management, L.L.C. He developed the scorecards to address many of the problems inherent in measuring poverty, such as cost, time and accuracy. Schreiner realized that direct measures are costly, time consuming and hard to verify. Direct measures often take 1-2 full days per household to assess and ask questions such as “how many carrots did you eat last week? How much did they cost?”. On the other hand, indirect scoring costs less, can be completed in 5-10 minutes per household, and is more accurate and more easily verified. Indirect scoring asks questions with observable indicators such as “do you have a tin roof?” or “do you cook with wood?” to assess poverty level.(9) Schreiner was able to keep the cards concise by realizing that many indicators of poverty are highly correlated. For example, “someone with a straw roof probably does not have indoor plumbing either. So if we know the roof is straw, we gain little - in terms of measuring poverty - from checking whether there is indoor plumbing.”(10) Schreiner selected indicators that were not only linked to poverty, but that were also objective, verifiable, quick to ask and answer, and liable to change over time, such as the possession of a fridge or color TV. He excluded indicators that relied on total value of assets, annual expenditures or subjective judgments. He then assigned each indicator a point value. When the points from each indicator are added up, the total gives a poverty score, which ranges from 0-100 (0 being the most poor and 100 being the least poor). The score then corresponds with the probability that a household is poor. Thus far, Mark Schreiner has developed poverty scorecards for over 30 different countries, including Bangladesh, Bolivia, Brazil, Cambodia, Ecuador, Egypt, El Salvador, Ethiopia, Ghana, Guatemala, Haiti, Honduras, India, Indonesia, Kenya, Malawi, Mali, Mexico, Morocco, Nepal, Nicaragua, Nigeria, Pakistan, Palestine, Peru, Philippines, Romania, Russia, Senegal, South Africa, Sri Lanka, Syria, Vietnam and Yemen. The Poverty Scorecards can be accessed at http://www.microfinance.com. Each poverty scorecard is unique and asks about indicators specific to the target country. Poverty scorecards are an effective and practical way to assess and identify poverty because each scorecard contains 10 simple indicators that field workers can collect and use to compute poverty scores in real time.(11)
Urban and Rural Poverty Comparisons
Though cities are growing, most of the poor populations of the world remain in rural areas. Rural areas are home to about 75% of the poor and are still expected to house 60% by 2025. Based on comparison studies, rural populations of Vietnam, India, and Zimbabwe suffered significantly more than urban populations did in categories that included numbers of impoverished residents, child mortality rates, sanitation quality, and levels of education.(12) This suggests that when dealing with averages (and not distinguishing between rich and poor urban groups), there appears to be what is generally considered an “urban advantage.”
On the other hand, averages do not account for major differences between socioeconomic groups within each region, and they do not reflect multidimensional forms of poverty. Large groups of the urban poor live in environments equal to or worse than those of rural villagers, in terms of health. Though rural families may not have the sanitation services, for instance, that many urbanites have, rural communities have lower population densities, helping to limit the spread of disease.(13) Thus, even if there is an “urban advantage” in some aspects of life, there can also be an “urban disadvantage” in other dimensions, creating concepts of “poor” that are not necessarily related to income or consumption. While many differences exist within cities, variety between cities is also important to note. In East Asia, for example, “more than 90 % of the poor live in rural areas,” while Latin America and the Caribbean have more of an urban poor population, with rural families comprising 40% of the poor.(14)
When comparing averages, it is important to remember that city and countryside communities work together and influence each other. Christopher Dye of the World Health Organization (WHO) uses the term “national metabolism” to describe the interaction between cities and rural areas.(15) Studies show that the wealth of cities often directly benefits rural villagers. On the other hand, greater availability of jobs draws people to migrate to cities, where they then suffer from unfamiliar urban poverty. In this way, improvements in rural poverty can aid urban poverty as well.(16)
Urban Poverty
Several features distinguish urban poverty from poverty in other areas. As Mark Montgomery summarizes in his report, these features include:
“The monetization of urban living; the spatial concentration of the population in environments that are sometimes but not always well-supplied with protective public services; the inescapable economic and social diversity that confronts the urban-dweller in daily life; and the geographic proximity of modern health care institutions that may nevertheless lie beyond the reach of the poor – these and similar factors are far more prominent in urban than in rural settings.”(17)
Types of Poor
The urban poor are not a homogenous group; there are three discernible categories of poor urban dwellers, according to Akin L. Mabogunje, Chairman of the Presidential Technical Board of the Federal Mortgage Bank of Nigeria. The first is the “new poor” who have been recently impoverished, and the second is the “borderline poor” who are employed yet unskilled and below the poverty line. The third is the “chronic poor” who have been poor for five or more years and are sometimes impoverished due to the process of migration to cities, rather than from urban poverty itself.(18) Furthermore, children make up a large percentage of the urban poor population. For example, in Bangladesh, the majority of residents are under fifteen years old. Despite child advocacy interventions, many of these children and teenagers are part of the workforce.(19)
Slums
A large proportion of cities’ poor residents live in slums. According to studies by WHO and the United Nations Human Settlements Programme (UN-HABITAT), one third of all urban inhabitants reside in slums or informal settlements, and more than 90% of slums exist in cities within developing countries. Typically, the fastest growing cities have the highest concentrations of these settlements. In a recent study comparing regions in the developing world, Sub-Saharan Africa was found to have the highest rate (62%) of urban residents living in slums.(20)
A slum residence is defined by UN-HABITAT as one with “inadequate housing, sanitation, tenure security, and no or few basic services.”(21) This type of housing exists in a variety of forms, “from high-rise tenements to shacks to plastic sheet tents on sidewalks.”(22) These critical challenges that slums face should be the focus of future development strategies, as slums often have the worst conditions and health risks within cities.
Footnotes
(1) Shetty, P. "Health Care for Urban Poor Falls Through the Gap.” The Lancet 377 (February 2011): 627-628.
(2) Montgomery, M. “Urban Poverty and Health in Developing Countries.” Population Bulletin 64 (June 2009): 2-15.
(3) United Nations. The World’s Cities in 2016. https://www.un.org/en/development/desa/population/publications/pdf/urbanization/the_worlds_cities_in_2016_data_booklet.pdf.
(4) Dye, Cr. “Health and Urban Living.” Science 319 (2008): 768-769.
(5) World Health Organization (WHO), and United Nations Human Settlements Programme (UN-HABITAT). Hidden Cities: Unmasking and Overcoming Health Inequities in Urban Settings. 2010.
(6) Montgomery, M. “Urban Poverty and Health in Developing Countries.” Population Bulletin 64 (June 2009): 2-15.
(7) Ibid.
(8) Satterthwaite, D. “The Links between Poverty and the Environment in Urban Areas of Africa, Asia, and Latin America.” The ANNALS of the American Academy of Political and Social Science 590 (November 2003): 73-91.
(9) Schreiner, M., Biggar, N., Caire, D., DeGiovanni, F., Hashemi, S., Sinha, F., & Toohig, J. (2014). Simple Poverty Scorecards.
(10)“Microfinance: a way to help the poor build assets.” http://www.microfinance.com/.
(11) Ibid.
(12) World Resources Institute. “Why Focus on Rural Rather Than Urban Poverty?” World Resources 2005: The Wealth of the Poor: Managing Ecosystems to Fight Poverty. World Resources Institute.
(13) Montgomery, M. “Urban Poverty and Health in Developing Countries.” Population Bulletin 64 (June 2009): 2-15.
(14) World Resources Institute. “Rural Share of Poverty, 1993 and 2002”World Resources 2008: Roots of Resilience. World Resources Institute, 2008.
(15) Dye, C. “Health and Urban Living.” Science 319 (2008): 768-769.
(16) “Urban and Rural Poverty”
(17) Montgomery, M. “Urban Poverty and Health in Developing Countries.” Population Bulletin 64 (June 2009): 2-15.
(18) Mabogunje, A. “Global Urban Poverty Research Agenda: The African Case ” Urban Update: Comparative Urban Studies Project 10 (January 2007): 1-18.
(19) Environmental Health Project. Improving the Health of the Urban Poor Learning from USAID Experience. 2004. 1-13.
(20) World Health Organization (WHO), and United Nations Human Settlements Programme (UN-HABITAT). Hidden Cities: Unmasking and Overcoming Health Inequities in Urban Settings. 2010.
(21) United Nations Human Settlements Programme (UN-HABITAT). Urban Health Inequities: La Paz, Bolivia.
(22) Environmental Health Project. Improving the Health of the Urban Poor Learning from USAID Experience. 2004. 1-13.