CERTIFICATE IN GLOBAL HEALTH RESEARCH
Course 14: Measuring Poverty and Poverty Scorecards
It can be quite difficult to determine which people in a given community live below the poverty line. People who are poor frequently do not have documentation of their savings or purchases. This article discusses why it is important to measure poverty, elucidates a variety of methods that have previously been used to measure poverty, and discusses poverty scorecards, a practical and effective way to measure poverty.
The Importance of Measuring Poverty
In the U.S. and in many other developed countries, it is important to measure poverty because the poverty line is used to determine eligibility for federal, state, and local aid, including food stamps and health insurance. In low- and middle-income countries, understanding poverty levels is important for generating policy, targeting development initiatives, and monitoring and evaluating economic progress over time.
An Absolute Approach: The $1/Day Classification
In 1990, the World Bank classified those living on less than $1.00 per day to be living in extreme poverty. In 2008, this measurement, known as the international poverty line (IPL), was revised to $1.25 per day. In 2015, it was again updated to $1.90 per day to factor in the evolution of costs of living worldwide.(1) This measure was previously used as the basis for one of the Millennium Development Goals, which sought to reduce the proportion of people living on less than $1.00 per day by half. The $1.90 per day classification is used to assess poverty worldwide, but it is flawed for many reasons. First, it focuses exclusively on income and consumption. It fails to take into account other issues of poverty beyond income, such as severe deprivation of basic human needs, including food, safe drinking water, sanitation facilities, health, shelter, education and access to social services.(2) For example, there are many families in India who earn more than US$1.90 per day who still cannot afford a proper toilet, while Tanzanians make lower wages, on average, but are more likely to be able to provide food and water for their families.(3) Second, by defining poverty as those who live on less than $1.90 per day, there is an implication that it is acceptable for people to live at, or just above, this income level.(4) This method of defining poverty is also flawed because it can encourage policy makers to focus on promoting economic growth without regard to the consequences, such as increased social inequality and adverse environmental impact.(5)
An Absolute Approach: The U.S. Federal Poverty Line
The poverty line in the U.S. was determined in the mid-1960s by Mollie Orshansky, an economist working at the U.S. Social Security Administration. She determined that in the 1960s the average family spent one-third of its budget on food, so she set the poverty line at roughly three times the amount of basic food costs. Though this number has been updated to account for inflation, the same 1960s formula is still used to determine the poverty line.(6) The current poverty line is $12,060 for a single person and $24,600 for a family of four.(7) This method is considered to be flawed because there are large regional variations in the cost of goods and services, and it does not take into account other costs, such as childcare and healthcare.(8)
A Relative Approach: The European Union
The European Union defines poverty as those households whose income is less than 60% of the national median income. This method is useful because it incorporates changes in median income. For example, as the overall wealth of a society increases, so would the poverty level. However, the fact that this method reflects the country's overall income distribution is also a weakness since changes in the poverty rate may not reflect actual changes. For example, when Ireland flourished economically in the late 1990s, their poverty rate, paradoxically, did so as well. As the median income rose, many families who didn’t experience any change in income were now classified as poor.(9)
An Innovative Approach: Poverty Probability Index Scorecards
Poverty probability index scorecards were originally developed by Mark Schreiner, the director of Microfinance Risk Management, L.L.C. He developed the scorecards to address many of the problems inherent in measuring poverty, such as cost, time, and accuracy. Schreiner realized that direct measures are costly, time-consuming, and hard to verify. Direct measures often take 1-2 full days per household to assess and ask questions such as “how many carrots did you eat last week? How much did they cost?” On the other hand, indirect scoring costs less, can be completed in 5-10 minutes per household, and is more accurate and more easily verified. Indirect scoring asks questions with observable indicators such as “do you have a tin roof?” or “do you cook with wood?” to assess poverty level.(10) Schreiner was able to keep the cards concise by realizing that many indicators of poverty are highly correlated. For example, “someone with a straw roof probably does not have indoor plumbing either. So if we know the roof is straw, we gain little - in terms of measuring poverty - from checking whether there is indoor plumbing.”(11) Schreiner selected indicators that were not only linked to poverty, but that were also objective, verifiable, quick to ask and answer, and liable to change over time, such as the possession of a fridge or color TV. He excluded indicators that relied on total value of assets, annual expenditures, or subjective judgments. He then assigned each indicator a point value. When the points from each indicator are added up, the total gives a poverty score, which ranges from 0-100 (0 being the most poor and 100 being the least poor). The score then corresponds with the probability that a household is poor. Thus far, Mark Schreiner has developed poverty scorecards for over 30 different countries, including Bangladesh, Bolivia, Brazil, Cambodia, Ecuador, Egypt, El Salvador, Ethiopia, Ghana, Guatemala, Haiti, Honduras, India, Indonesia, Kenya, Malawi, Mali, Mexico, Morocco, Nepal, Nicaragua, Nigeria, Pakistan, Palestine, Peru, the Philippines, Romania, Russia, Senegal, South Africa, Sri Lanka, Syria, Vietnam, and Yemen. The Poverty Scorecards can be accessed at www.microfinance.com. Each poverty scorecard is unique and asks about indicators specific to the target country. Poverty scorecards are an effective and practical way to assess and identify poverty because each scorecard contains ten simple indicators that field workers can collect and use to compute poverty scores in real time.(12)
An example of a poverty scorecard for Ecuador:
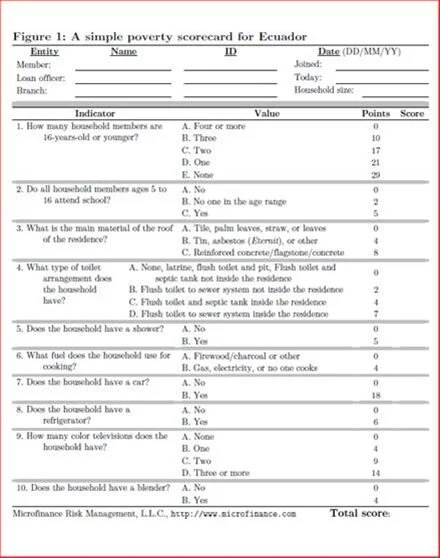
The scorecard is one page, concise, and asks questions that provide simple responses. In this example, let’s assume that a household had a total score of 33. This score would then be used to estimate the poverty likelihood associated with that score. For Ecuador, the likelihood of being below the poverty line according to household score is represented in the following table.

Thus, a score of 33 would mean that the household has a 71.3% chance of living below the poverty line (713 of 1,000 people scoring in this range are poor). These % estimates were derived from a national survey, which compared households receiving a specific poverty score to the actual number of households at that score who lived below the poverty line. Therefore, the likelihood of a household being below the poverty line for a given score is not the same across countries. Instead, it is derived from data from each individual country.(13)
Applications
Poverty probability index scorecards have three main uses:(14)
Measure poverty rates and give an estimate of how many people are below the poverty line. This is particularly useful for organizations that want to know what share of its participants are below a poverty line, to determine the progress of projects related to the new Sustainable Development Goals, and for organizations that might want to report how many of its participants are among the poorest half of those living below the poverty line (this is required of USAID microenterprise partners).
Track changes in poverty over time.
Enable aid and microfinance organizations to target services for program purposes to specific populations.
Recent Uses of Poverty Indices
Targeting the Poor in Pakistan
The Rural Support Programmes (RSPs) have been working in Pakistan since 1982, mainly with poor, rural communities. Their primary objective is to empower local community members to help improve the management and delivery of basic services and to identify their needs. The RSPs recently used a poverty scorecard for Pakistan developed by Mark Schreiner to measure change in poverty and to support the development of microfinance organizations in the area.(15)
Targeting the Poor in Bosnia-Herzegovina: The Prizma Poverty Scorecard
Prizma, a financially self-sufficient microfinance organization based in Sarajevo, created their own poverty scorecard to enable the “organization to understand and demonstrate more clearly and on a regular basis the extent to which it is (a) reaching who it seeks (and claims) to be reaching and (b) fulfilling its social mission.” The scorecard is comprised of two sets of indicators. One indicator reflects poverty risk, by measuring education level, residence, and household size, while the other reflects change in household poverty by measuring household assets, transport assets, meat consumption, and sweet consumption. By using non-economic indicators, Prizma ensures the accuracy of its measurements because clients are less likely to misrepresent non-income data, especially demographic data that is easy to verify. Points are given for each indicator, and poverty is assessed on a scale of 0-9, with 0 being the most poor, and 9 being the least poor. Those who score 0-2 points are considered very poor and live below the poverty line, while those scoring 3-4 points are considered vulnerable non-poor and live between 100-150% of the poverty line, while those scoring 5 or more points are considered non-poor and live at or above 150% of the poverty line. The scale helps Prizma assess the relative need of each of their households. For example, a household that has a total score of one can clearly be said to be poorer that a household with a score of four. The scorecard also enables staff to generate reports on client household poverty status, which enables the organization to segment its clientele, provide improved and efficient service, track dropout rate by poverty status, and adapt their services to the developmental needs of poorer clients.(16)
Poverty Scorecard Used By Prizma

Pro-Mujer: Microfinance Loans in Bolivia
Pro-Mujer is an international women’s development and microfinance organization focused on empowering women in Latin America. In Bolivia, Pro-Mujer offers group-based loans and savings programs to over 260,000 clients. The organization wanted to determine how effectively their loans reduced poverty in Bolivia. To assess this, they used the “Simple Poverty Scorecard for Bolivia” developed by Mark Schreiner. Using the poverty scorecard, they determined each woman’s poverty status before and after she took out a loan. Those families who were deemed poor (scoring under 50 points on the scorecard) received loans. As a result of the loans, they found that the poverty scores increased by an average of 10.8 points. On the other hand, those in the control group did not receive loans, and only improved their poverty scores by 2.4 points. Thus, this suggests that “continuous access to credit does have a positive impact on housing standards and goods accumulation and, presumably, poverty.”(17)
Conclusion
Determining who is poor and who is not poor is a difficult task because the cost and standard of living varies greatly between region and country. Additionally, poverty is determined by numerous variables, including income, assets, education, health, and access to social services. Historically, poverty was assessed based on income, which neglected other assets and costs, and it also did not account for regional and national variation in prices. The poverty scorecards are considered a valuable alternative to traditional methods of measuring poverty.
Footnotes
(1) The World Bank. 2015. “FAQs: Global Poverty Line Updates.” http://www.worldbank.org/en/topic/poverty/brief/global-poverty-line-faq.
(2) Woodward, D. (2010). How Poor is' poor'?: Towards a Rights-based Poverty Line. New Economics Foundation.
(3) “A New Definition of Poor.” Accessed on 30 August 2010.
(4) Woodward, D. (2010). How Poor is' poor'?: Towards a Rights-based Poverty Line. New Economics Foundation.
(5) Kapur, A. “Changing Poverty’s Parameters.” New York Times. (Aug. 12, 2010). https://www.nytimes.com/2010/08/13/world/asia/13iht-letter.html.
(6) O’Brian, R. L., & Pedulla, D. S. (2010). Beyond the poverty line. Stanford Soc Innovat Rev, 8, 30-35.
(7) HealthCare.gov. Federal Poverty Level (FPL).
(8) National Research Council. (1995). Measuring poverty: A new approach. National Academies Press.
(9) O’Brian, R. L., & Pedulla, D. S. (2010). Beyond the poverty line. Stanford Soc Innovat Rev, 8, 30-35.
(10) Schreiner, M. “Simple Poverty Scorecards.” https://www.shareweb.ch/site/EI/Documents/Events/SC-Forum/SC-Forum%202007-10%20Poverty%20Scorecards/SC-Forum%202007-10%20Poverty%20Scorecards%20-%20Pres-Schreiner-V%2018.10.07.pdf.
(11) “Microfinance: a way to help the poor build assets.” http://www.microfinance.com/.
(12) Ibid.
(13) Schreiner, M. (2009). A simple poverty scorecard for Ecuador. 2008a), http://www. microfinance. co m/English/Papers/Scoring_Poverty_Ecuador. pdf, consultado el, 31.
(14) Ibid.
(15) Khan, G. “Targeting the Poor in Sindh- Using the Poverty Scorecard.” (2010) 1-10.
(16) Matul, M., & Kline, S. (2003). Scoring change: Prizma’s approach to assessing poverty. Microfinance Centre for Central and Eastern Europe and the New Independent States Spotlight Note, (4).
(17) Gibb, S. (2008). Microfinance s Impact on Education, Poverty, and Empowerment: A Case Study from the Bolivian Altiplano (No. 04/2008). Development Research Working Paper Series.